
"Twice-Lent Money" page 5
M2 minus M1 is "Twice-lent Money"
Definition of 'M2' from Investopedia A measure of money supply that includes cash and checking deposits (M1) as well as near money. “Near money" in M2 includes savings deposits, money market mutual funds and other time deposits, which are less liquid and not as suitable as exchange mediums but can be quickly converted into cash or checking deposits. |
From the definition quoted above, it follows that M2 minus M1 excludes the cash and various forms of checking accounts that constitute M1 and leaves only savings deposits, money market mutual funds and other time deposits.
Therefore, we can conclude that M2 minus M1 is a proven ongoing volume of money that was created as one debt and is now either not available or only available as a second loan of itself. What are the consequences when this volume increases or decreases?
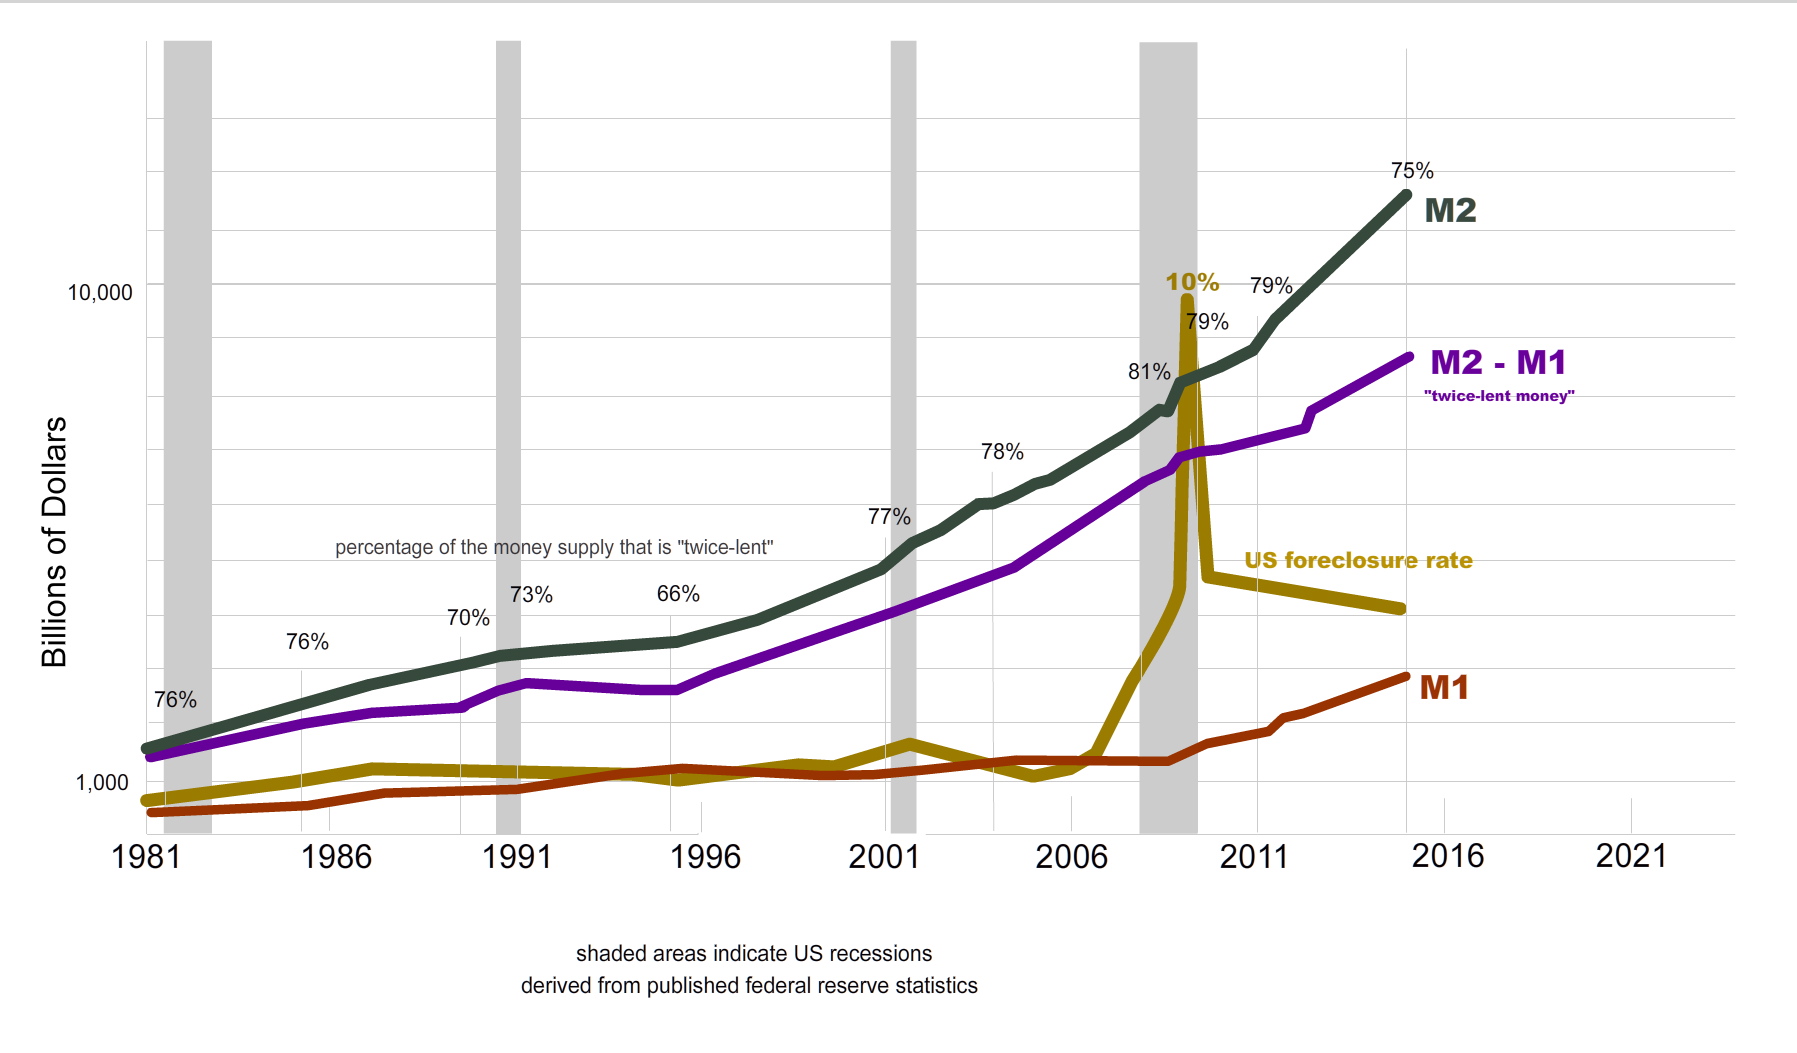
According to the chart below, bank savings normally constitute about 75% of M2. The recent crisis happened when bank savings hit 81% of M2. During the booming 90's, bank savings dropped as low as 66% of M2. Is there a rational cause and effect here?
On the graph below, the green line (savings plus cash & checking) rises steadily while the red line (cash & checking) rises and falls. Whenever the proportion of M2 that is savings (twice-lent money) increases for four years or more, a recession and foreclosures have followed. This is only logical once we realize that savings are an interruption of debt cycles. The increase in savings means a reduced supply of money available to be earned by borrowers without someone incurring another debt. If that debt is not incurred and the savings remain locked up, someone must default due to an actual shortage of available Principal.
US Money Supply
click on image for larger version
And that's not the end of the possible damage that could be caused by a perfectly natural slowdown in the demand for bank credit.
This graph only shows where the money was at that moment, in the banking system. It provides no information about how many private debts (N) might have been incurred on the way to it being deposited. In the case of N debts, any shortage of new bank-created Principal would be multiplied by N in resulting defaults.
On the other hand, there are mitigating factors such as ever growing government debt, rolling credit, interest-only mortgages, credit cards and banks creating debt-money to buy equities that put new money into the system that doesn't have to be paid back on a schedule. But the last three are pro-cyclical, meaning they shrink just when they are needed to expand. Only astronomically increasing government debt staved off collapse in the 2008 crisis (bailout). In Cyprus, the banks simply negated some of the banks' debts to their depositors (bail-in)
The full animated graphical explanation.
back / next ~ Who has these savings?